JSAE/SAE conference in Kyoto, Japan
NOx emissions have become a health concern in cities with calls to reduce and ban vehicles with CI engines from entering the city. As such, our aim is to reduce NOx emissions being produced by the CI engine, and Low Temperature Combustion (LTC) is seen as a viable option.
LTC is a broad term used generally for combustion techniques where the overall peak combustion temperature is reduced. This is beneficial as it reduces the formation of NOx exhaust gasses. LTC techniques include HCCI, PCCI and RCCI. Although NOx emissions is reduced as a result of lower temperatures, other emissions such as CO emissions and HC emissions can increase due to incomplete combustion.
There is thus a balance that needs to be optimised to ensure an overall reduction of all emissions. This research focussed on achieving emissions reduction by optimising EGR and the engine’s fuel delivery.
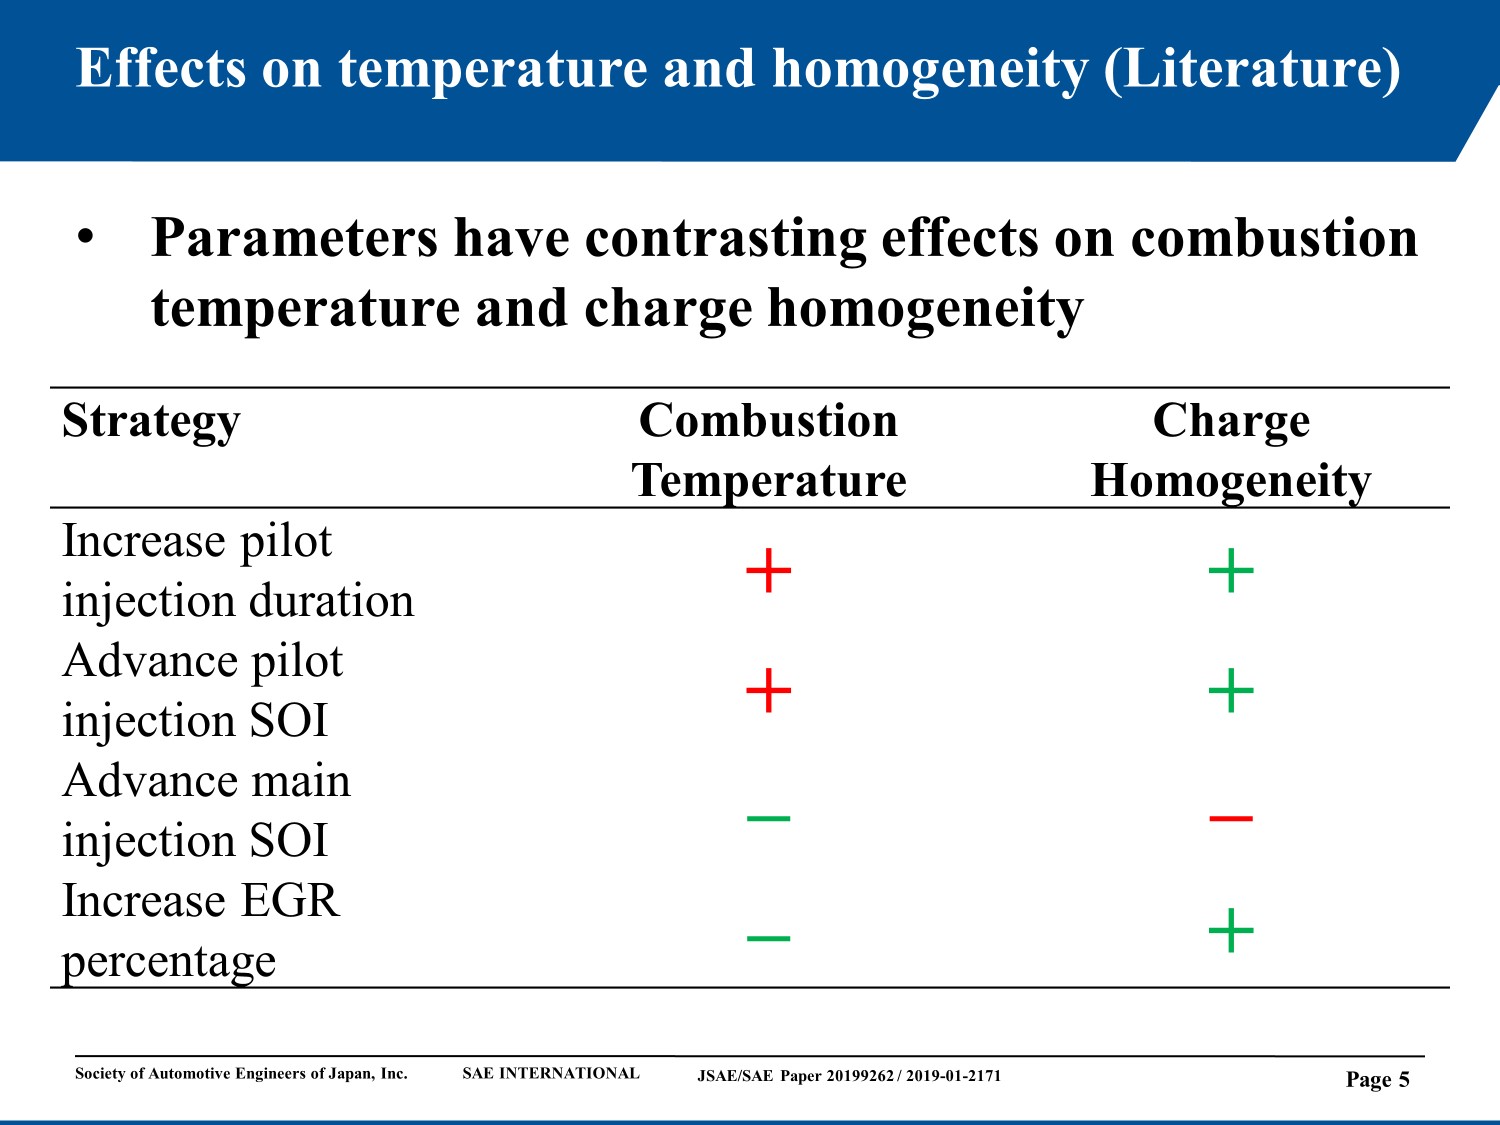
For this research we looked at four parameters that can be used to achieve LTC and ultimately reduce NOx and CO emissions. NOx emissions is reduced by reducing the combustion temperature and CO emissions are reduced by increasing the homogeneity of the air fuel mixture. The table shown in the slide shows the effects on the combustion temperature and the homogeneity of the air fuel mixture as reported in the literature.
If we increase pilot injection duration, then the homogeneity of the charge increases as more fuel is being introduced in the pilot injection and thus more of the fuel can mix with the air before combustion occurs. Premixed combustion also increases as a result of this, ultimately increasing the combustion temperature.
If we advance the pilot injection start of injection (SOI), then the homogeneity of the charge is increased, as there is more time for the fuel to mix with the air before combustion occurs. Increased homogeneity also increases the premixed combustion, which increases the combustion temperature.
If we advance the main injection SOI, then the time for the fuel to mix with the air is decreased, which reduces the homogeneity of the charge as well as the combustion temperature.
If we increase the Exhaust gas recirculation (EGR) percentage, then the homogeneity of the charge is increased, as more EGR increases the ignition delay and gives the fuel more time to mix with the air. It also reduces the combustion temperature as more inert gasses are introduced into the inlet charge, which absorbs a lot of the heat.
From this table, it can be seen that the four parameters have different effects on combustion temperature and charge homogeneity. It is thus necessary to determine which parameter has a significant effect on emissions formation and which parameter has a lesser effect.
The Design of Experiment (DoE) statistical tool was used to determine the effect of each parameter on the formation of engine emissions and if it is significant or not. A DoE was also used to determine the impact of each parameter as well as determine an optimised point that resulted in overall reduced emissions.
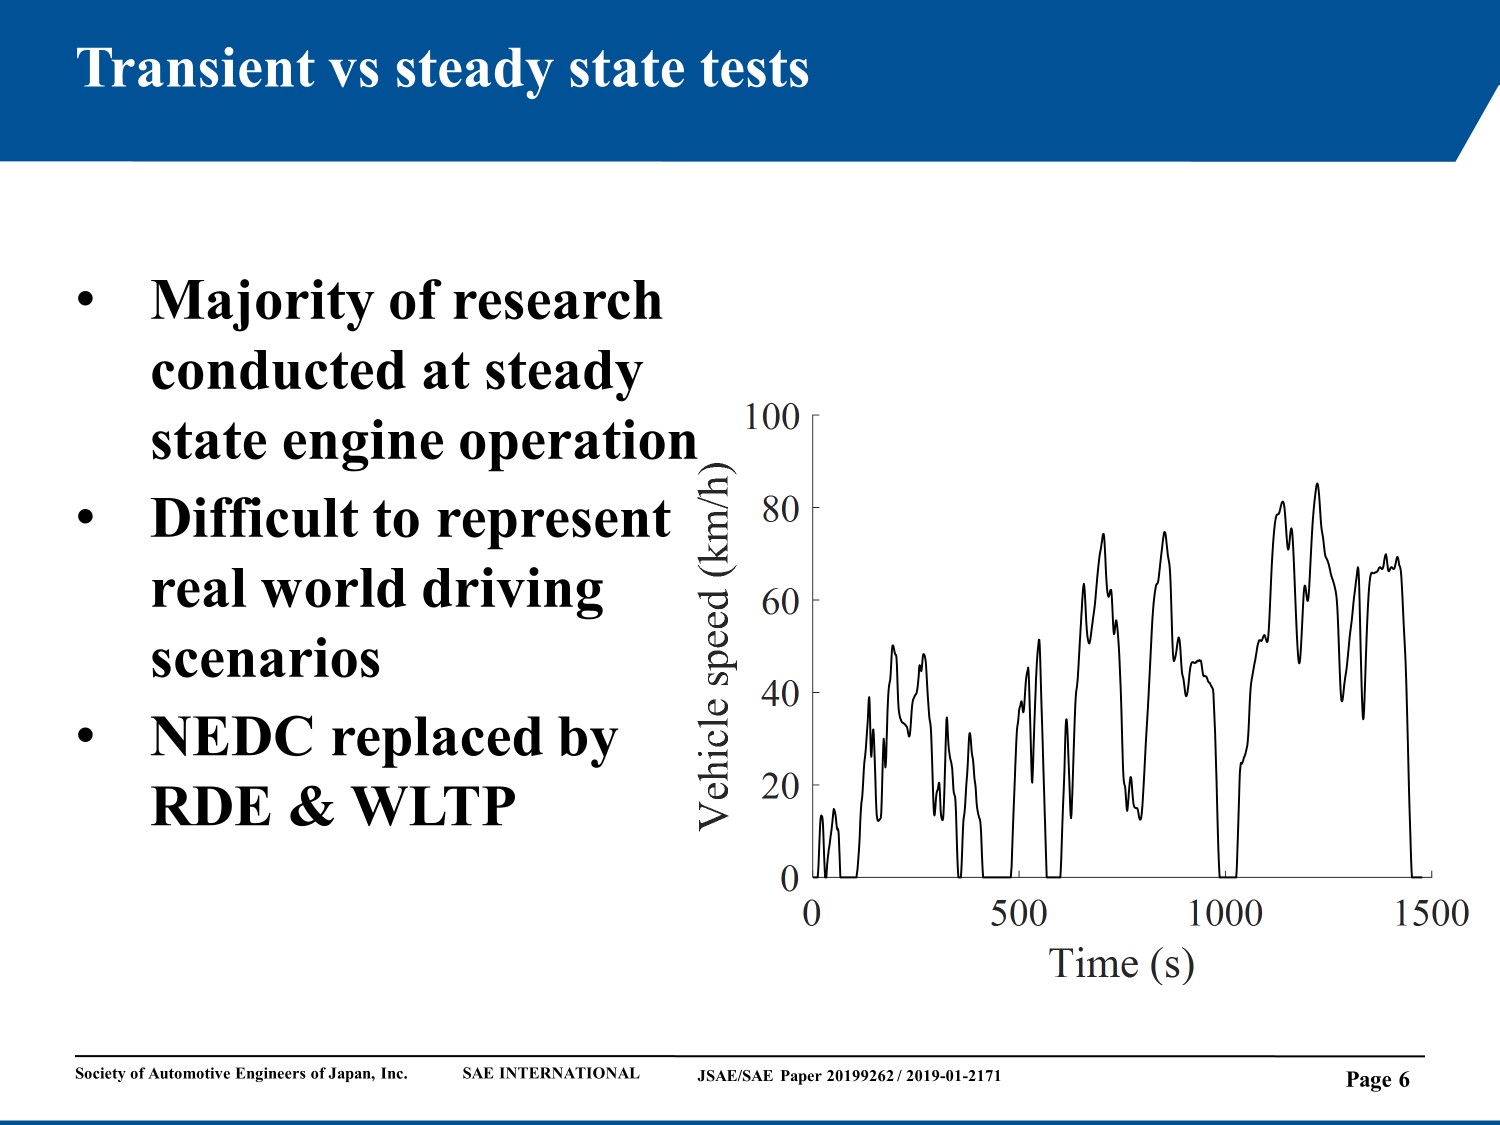
Next we need to consider the drive cycle that will be used in the simulation. When we look at how past research has generated experimental emissions data, the majority of research found have used steady state engine operating points in their test methodology. The results from steady state experimentation cannot accurately represent real life scenarios. A transient drive cycle is needed to generate results that are comparable to real life. The WLTP was used in this research. It replaced the NEDC that has been used in the past to test the new vehicle entering the market.
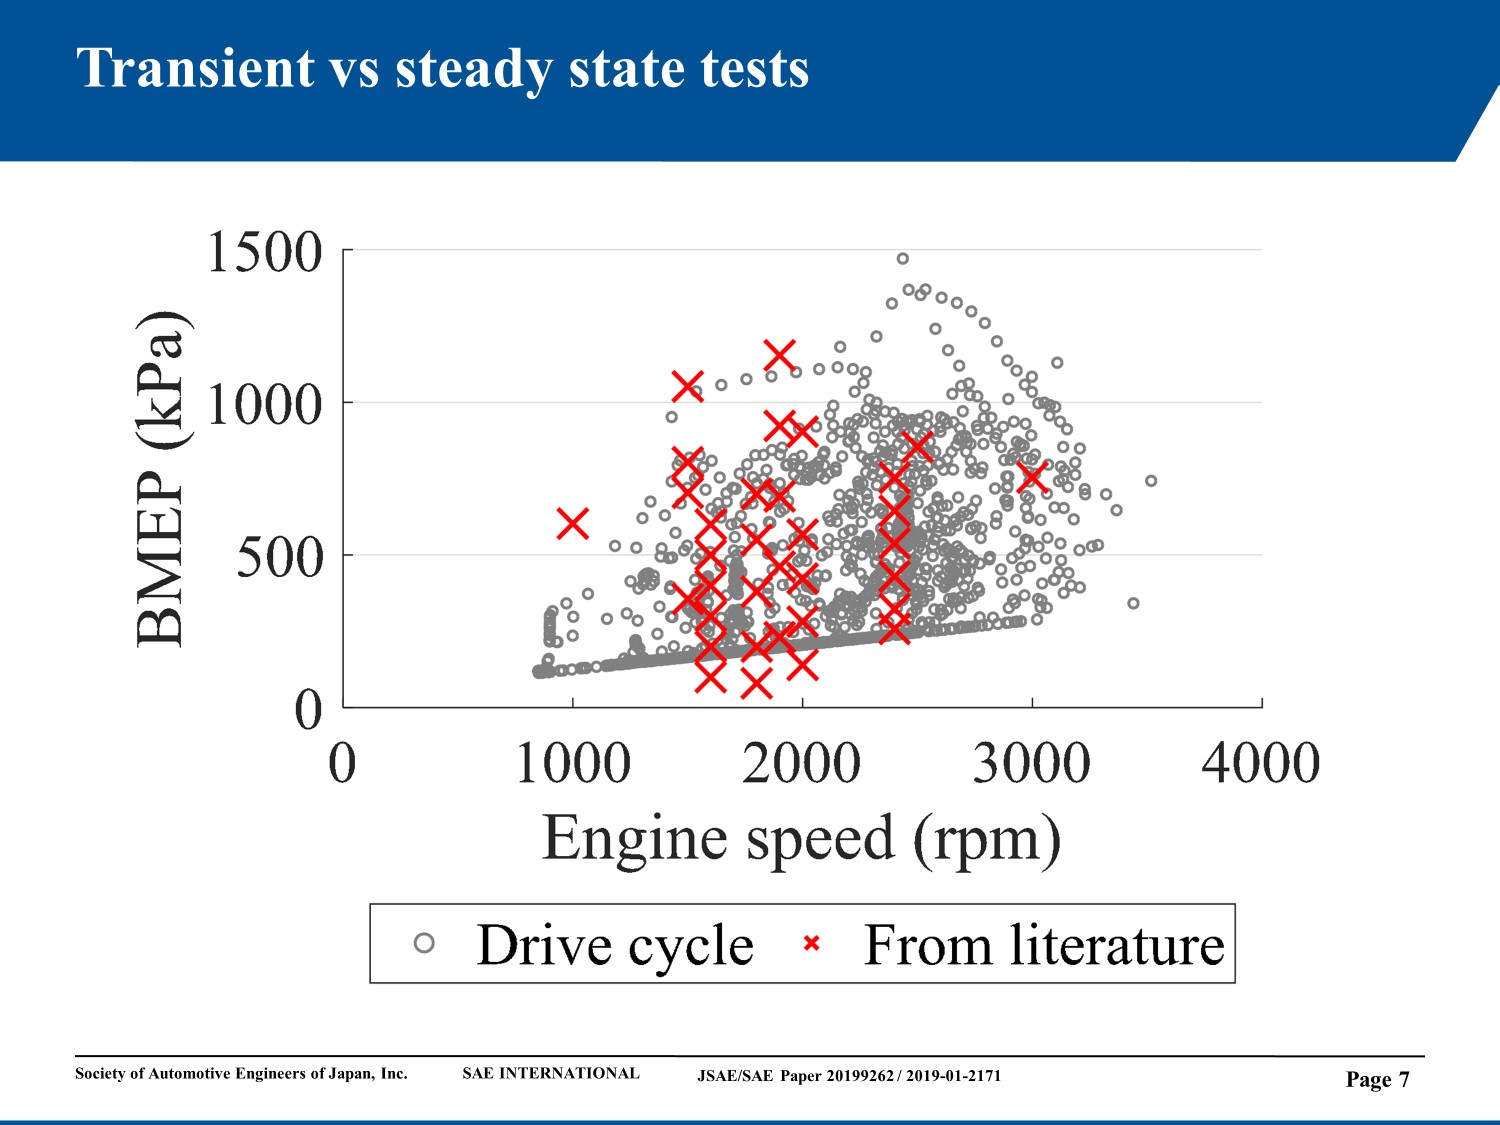
I have created this figure to further illustrate the benefits of using the WLTP for real world emissions investigation. The graph shows the WLTP, in grey circles, as a function of engine speed and BMEP. The red crosses indicate the steady state points used by past research to investigate engine emissions. When looking at the graph, clear gaps are evident in the engine operating map that is not covered by the research considered. The use of a transient drive cycle is thus appropriate if the results needed to be comparable to a real world scenario.
Methodology
An engine simulation was used to investigate the effects of varying the different engine operating parameters on engine emissions. A 2.4 L turbocharged CI engine was simulated. The simulation’s combustion model was validated using in-cylinder pressure data and emissions data was used to validate its emissions models.
The Wiebe combustion model was used in this research. Linear regression models was generated for the start of combustion crank angle degree (CAD), premixed fuel mass fraction burned and Wiebe exponent by using the cylinder pressure data. This is necessary as we are simulating a transient drive cycle as well as changing engine parameters that influence combustion. The emission models were validated using exhaust gas analyser experimental data. The engine simulation can only simulate CO emissions and NOx emissions.
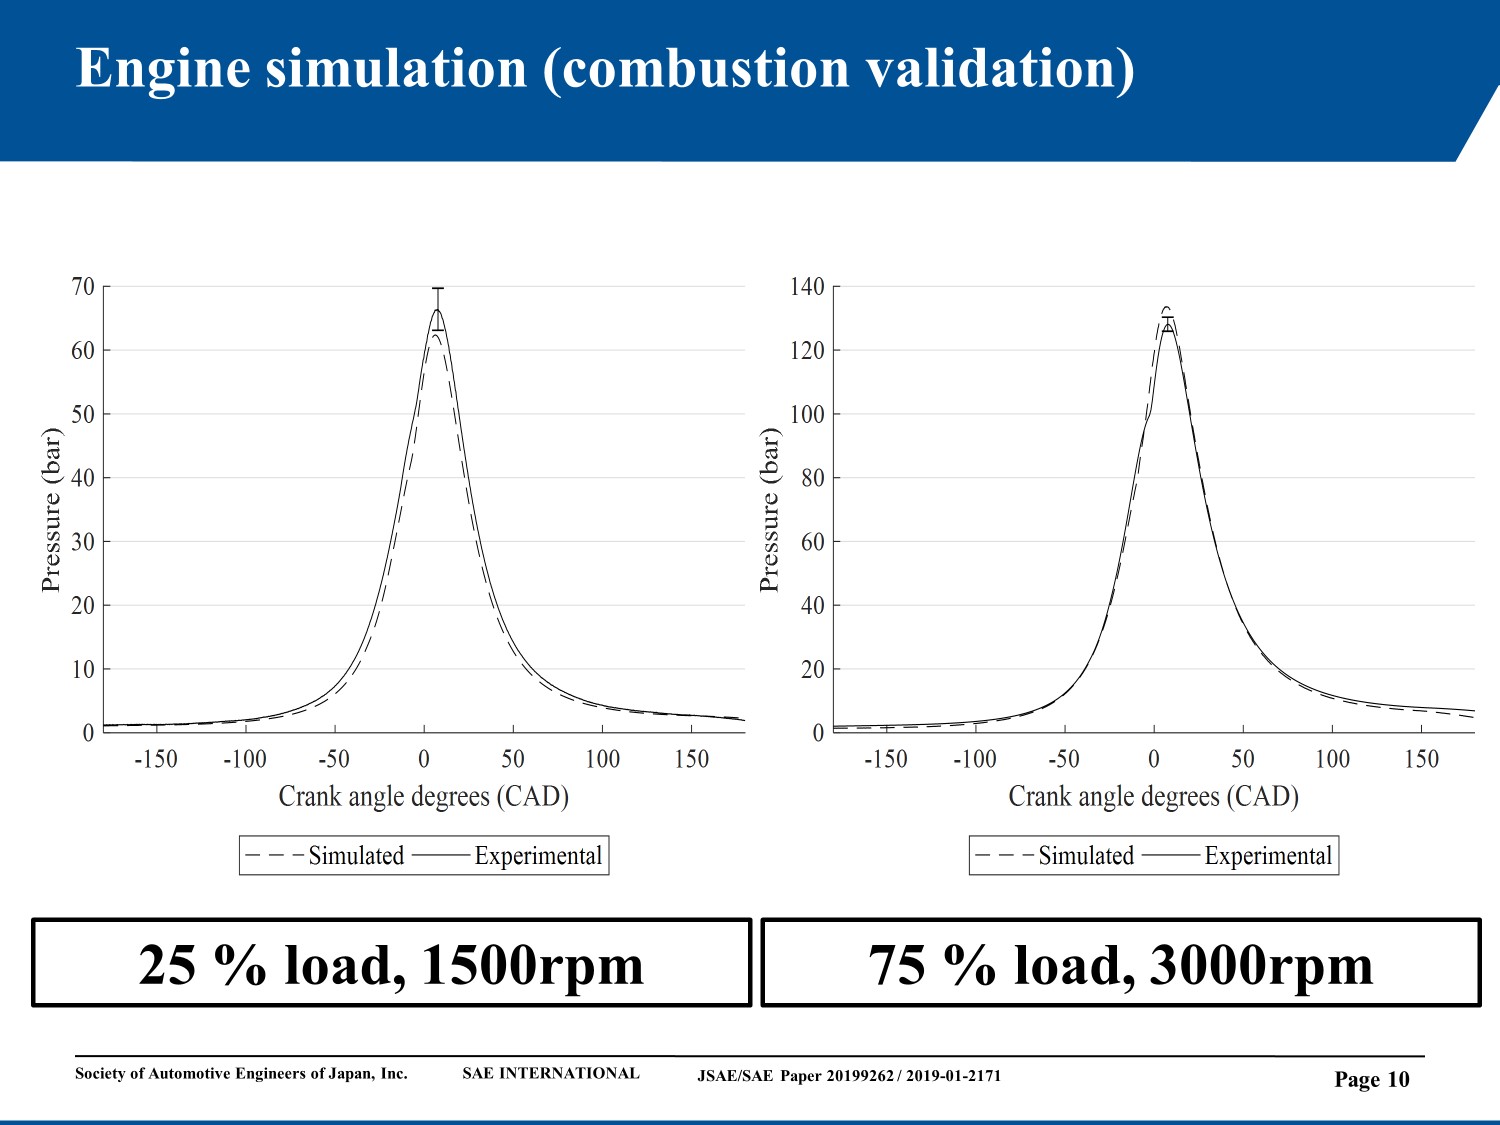
After the models were calibrated, it was compared to experimental data to check its accuracy. Here two cylinder pressure graphs are shown; one at 25% load and 1500rpm and the other at 75% load and 3000rpm. The experimental data is shown in a solid line and the simulated model is shown in dashed lines. As can be seen, the simulated results correlate well with the experimental data.
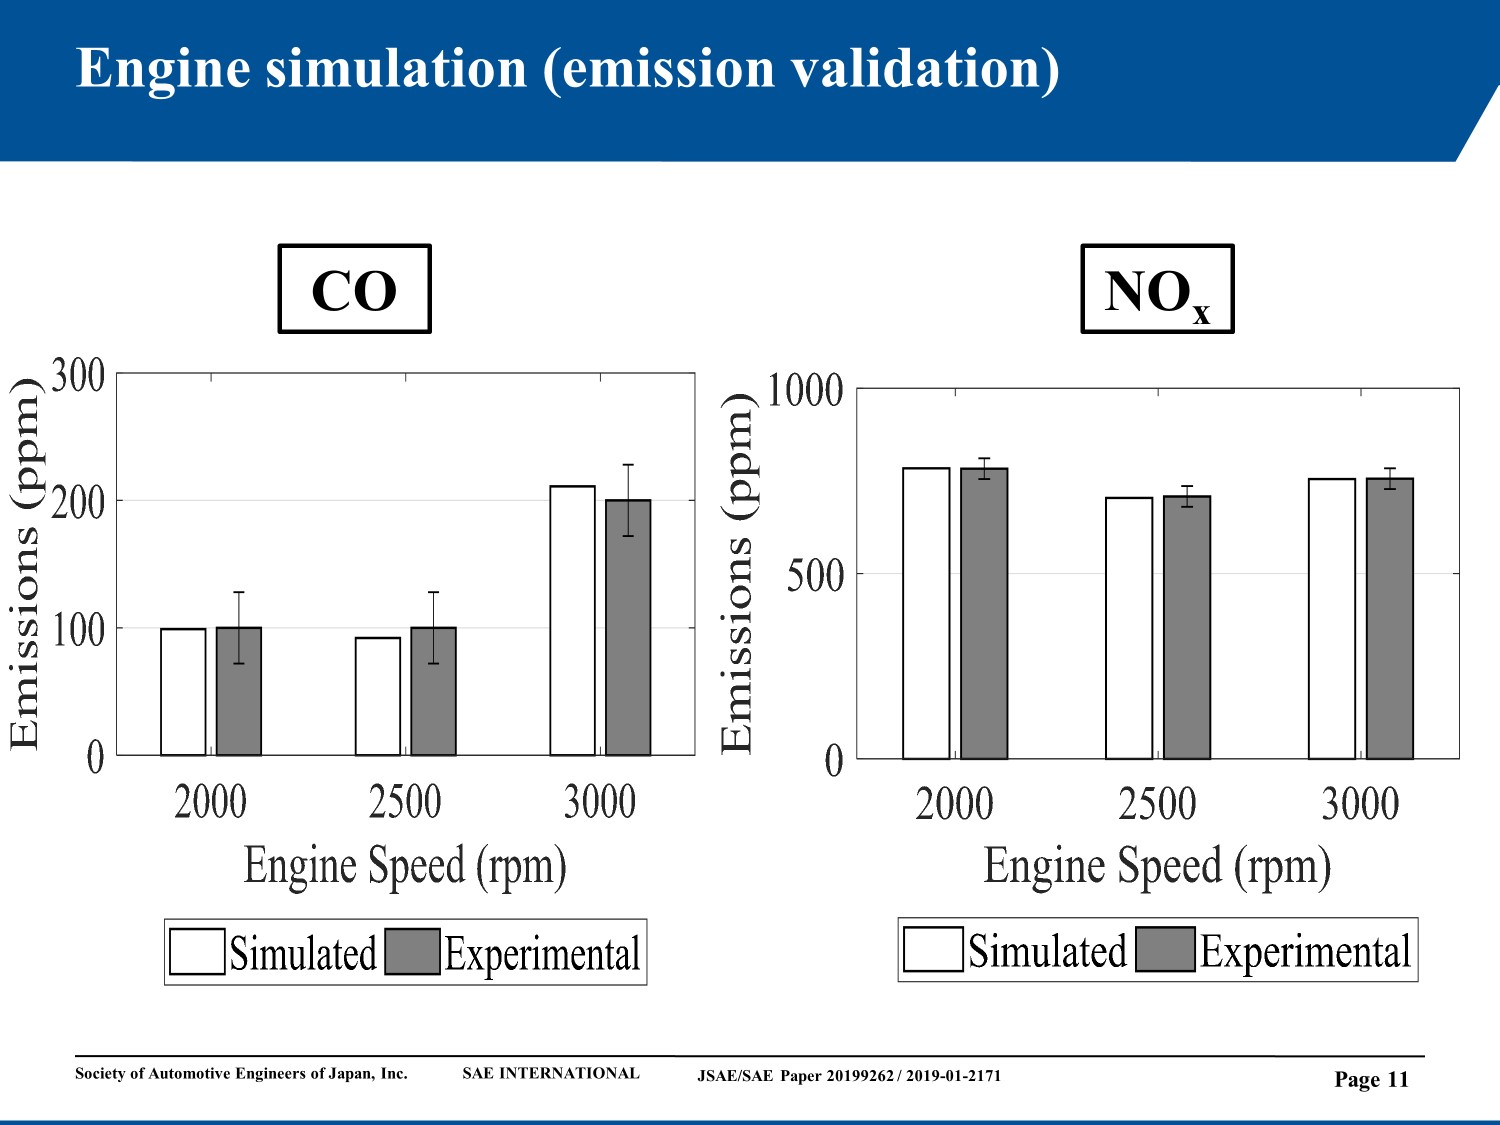
Same can be said of the simulated emissions. The simulated emission results for the CO emissions and NOx emissions correlate well with the experimental data. We thus have confidence in our simulation and can now move on to setting up the DoE.
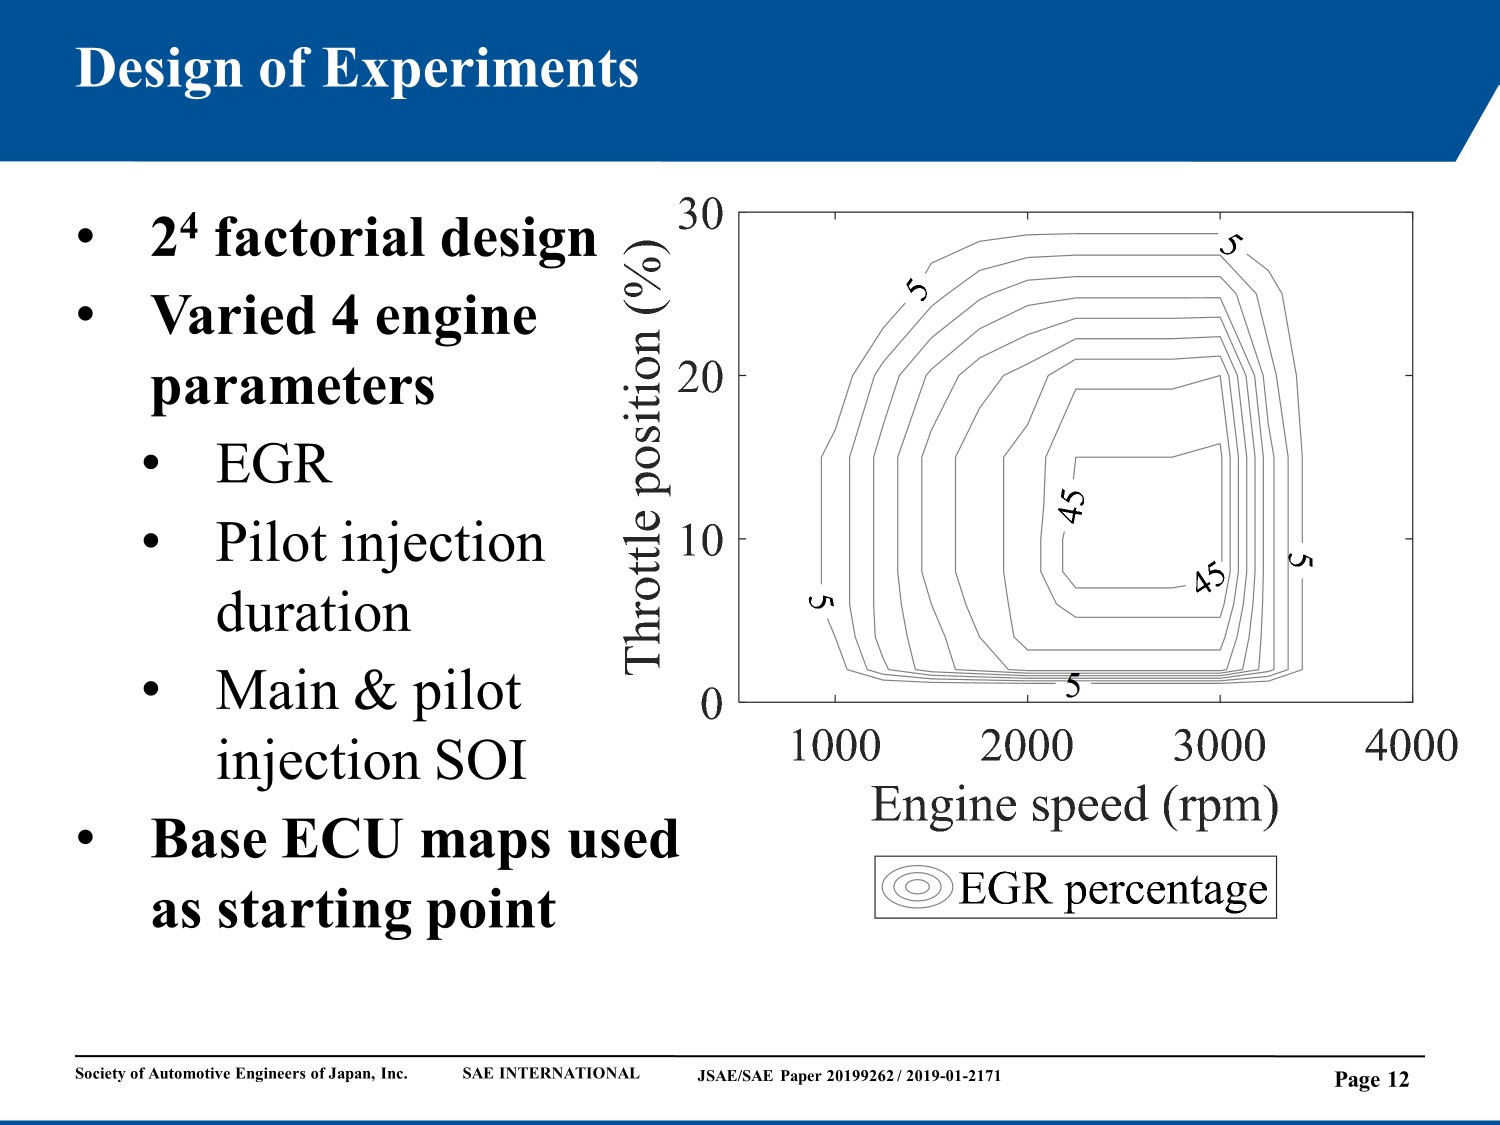
When setting up the factorial design, a 2^4 factorial design was chosen as there are 4 parameters that will be investigated. These are EGR percentage, pilot injection duration and main and pilot injection SOI. The test engine is using an aftermarket ECU, which have operating maps loaded onto it by default. These operating maps are used as the starting point for the DoE. The EGR percentage map is in the form of an island with maximum EGR at approximately 2500 rpm and 10 % throttle position. Here is an example of an EGR map with 47% as the maximum percentage. The value as given by the DoE will always be the maximum value and the maps will be scaled according to the maximum value.
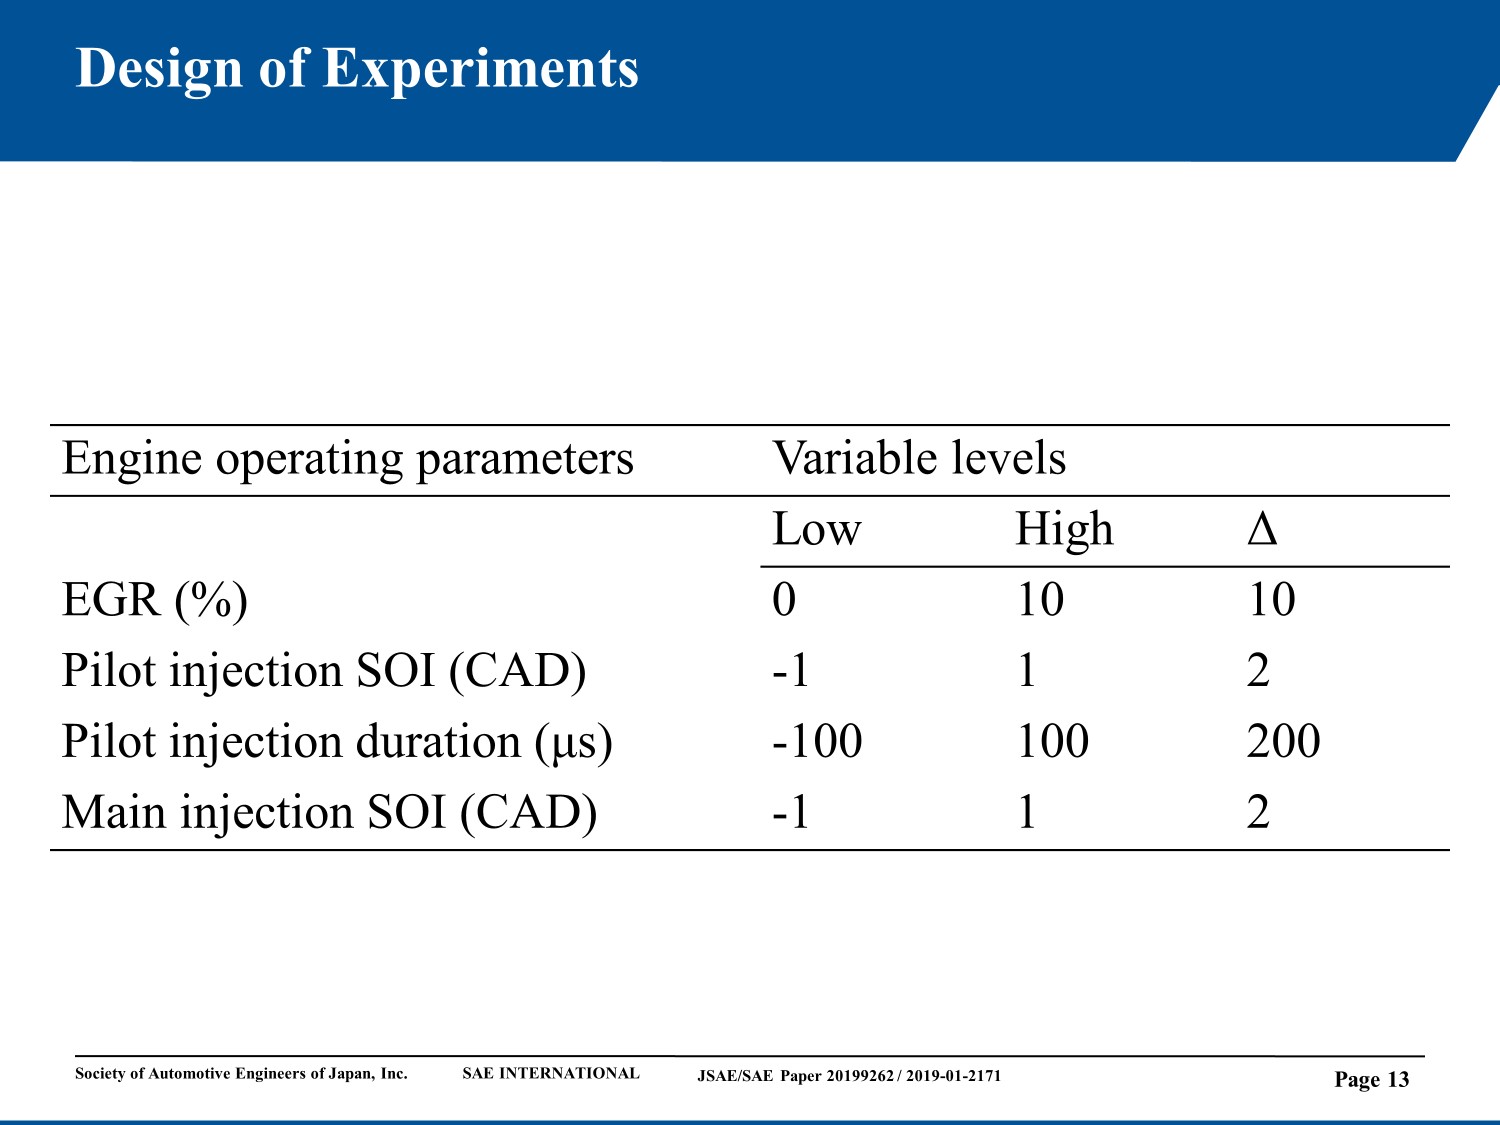
Shown here is a table with the low and high values of the first factorial design. The EGR percentage has a low and high value of 0 % and 10 %, pilot injection and main injection SOI is advanced by one CAD and retarded by 1 CAD. The pilot injection duration is decreased by 100 μs and increased by 100 μs. Similar tables were created for the second and third factorial designs based on the results from the previous factorial design.
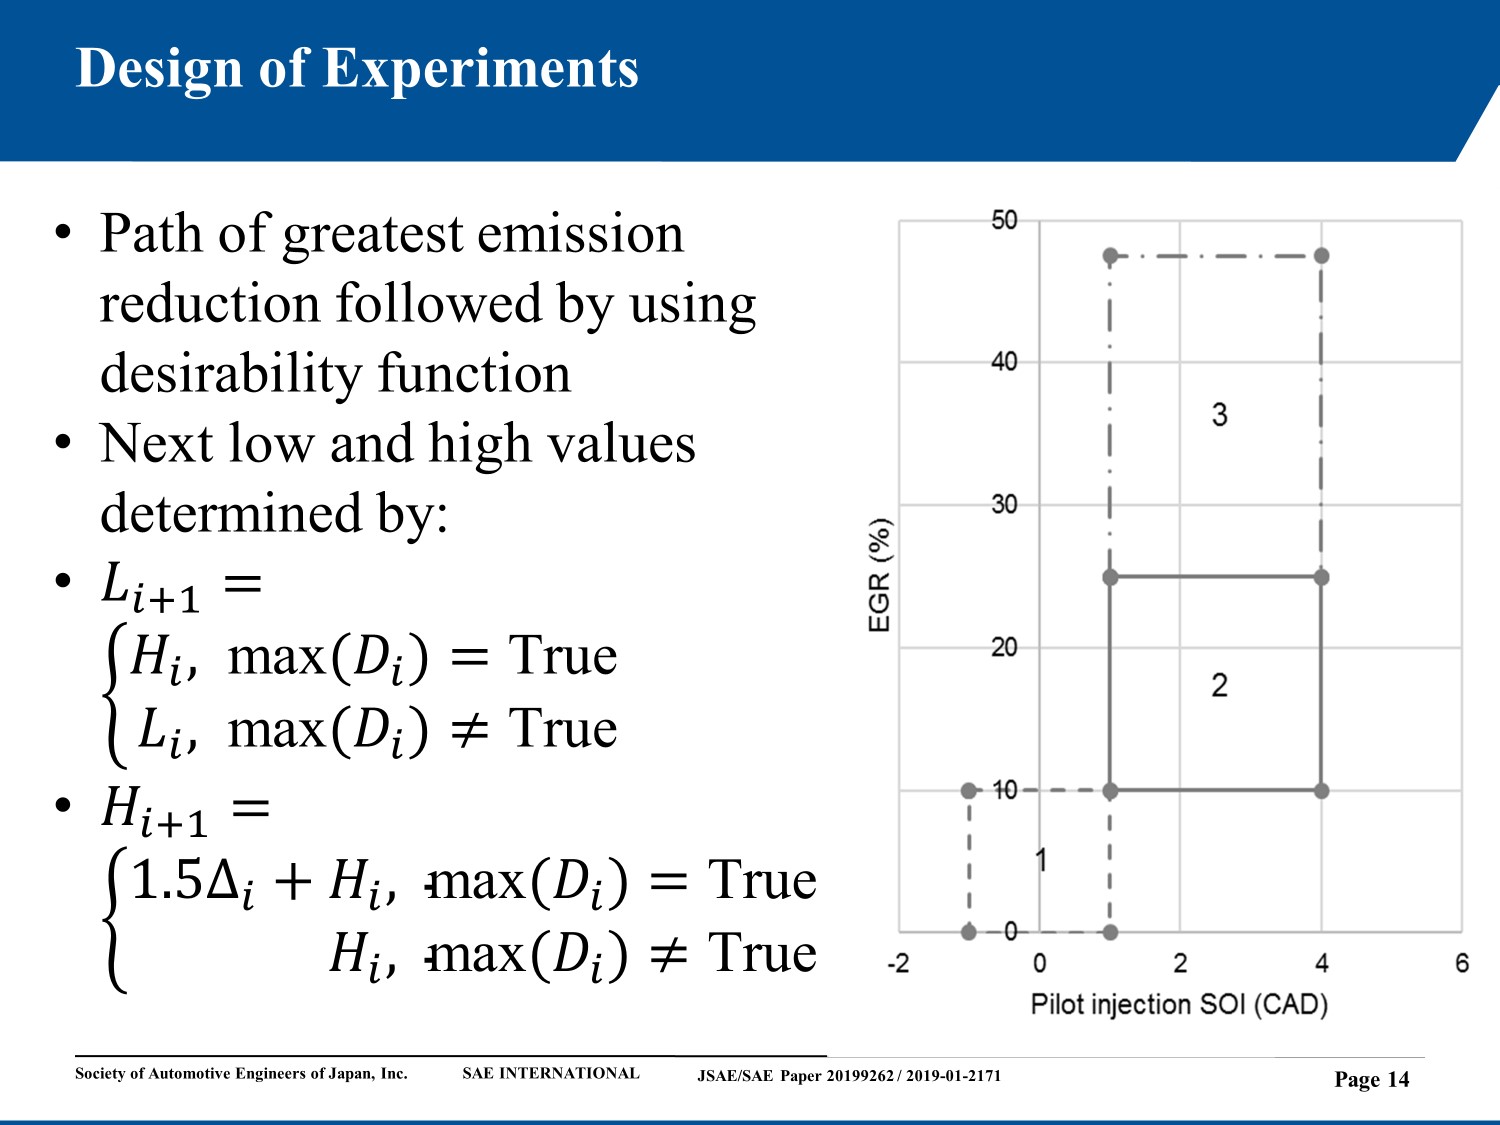
In order to determine the configuration that will reduce emissions the most, we opted to follow the path of greatest emission reduction using multiple factorial designs. After each factorial design, The desirability function was used to determine the best configuration of the parameters under investigation. This then was used to set up the next factorial design. This can be explained in the figure shown.
The figure shows the three factorial designs for two parameters, pilot injection SOI and EGR percentage. As can be seen for the first factorial design, the EGR is varied from 0 % to 10 % and the pilot injection SOI is advanced and retarded by 1 CAD. Once the first factorial design is completed, the desirability function is used to determine which configuration reduces the emissions the most. In this case it is an EGR percentage of 10 % and by retarding the pilot injection SOI by 1 CAD. The low and high values of the second factorial design can now be determined with the use of the two equations shown on the slide.
As a maximum desirability (Di) is achieved at 10 % EGR, the second factorial design’s low value becomes 10 % and the high level value for the second factorial design becomes 25 %. For the pilot injection SOI, the second factorial design’s low value is set to retard the map by 1 CAD and the high values is set to retard the operating map by 4 CADs.
Once the second factorial design is finished, the desirability function is used again to determine which configuration results in the reducing the emissions the most. This results in a EGR percentage of 25 % and retarding the pilot injection SOI by 2 CADs. As such the low and high values for the EGR percentage for the third factorial design is calculated as 25 % and 47.5%. The pilot injection SOI low and high values for the third factorial design stays at retarding the maps with 1 CAD and 4 CADs.
Results and discussion
Shown on this slide is the desirability function plot for the third factorial design that was simulated. As can be seen, by the third factorial design, the start of injection for the pilot and main injection and the injection duration of the pilot injection does not significantly influence the emissions. This can be seen by the almost horizontal lines of the graph.
The EGR percentage has a significant effect on the NOx emissions and CO emissions as the graph lines have a steep gradient. The desirability function plot at the top in the form of a half circle indicate that the maximum desirability value will be reached for an EGR percentage at approximately 36 %.
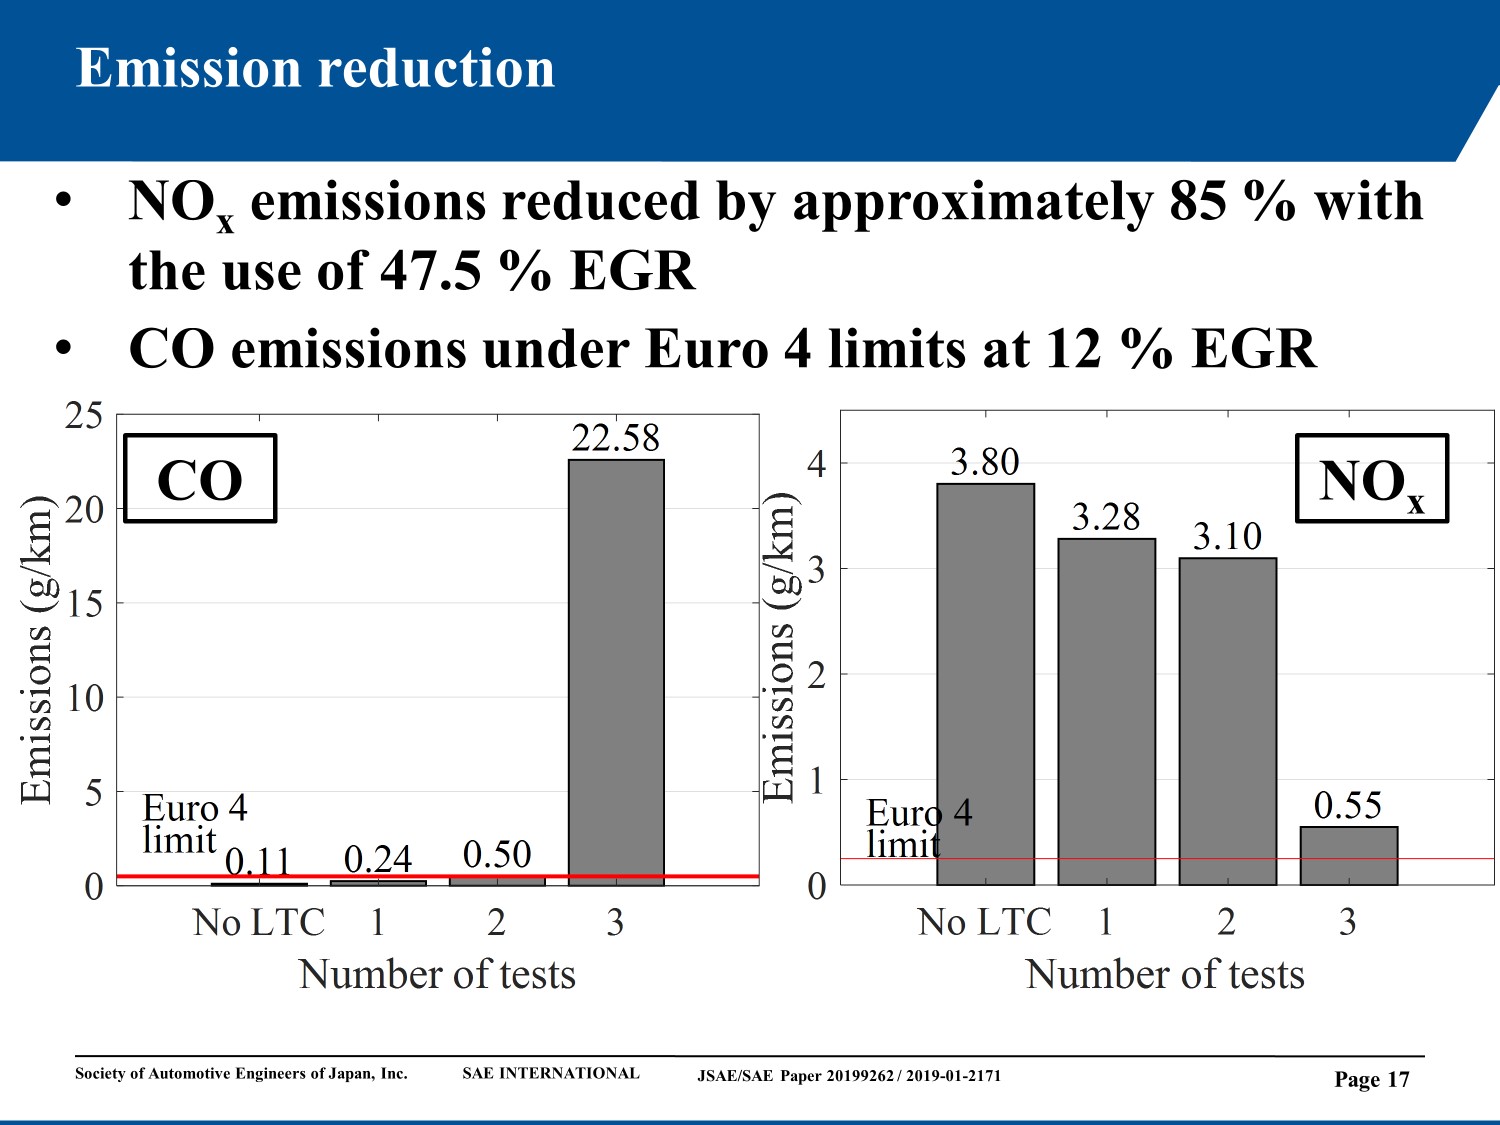
When we put all the factorial designs’ results on one graph, we can get a better overall picture. For the second factorial design, we optimised towards a maximum of CO emissions as per the Euro 4 limits. This resulted in a reduction of approximately 20% of NOx when we use a maximum of 12% EGR.
To further investigate LTC, for the third factorial design, we opted to continue to increase the EGR percentage to 47.5%. This resulted in a reduction in NOx of 85% to 0.55g/km where the Euro 4 limit is 0.25g/km. The CO emissions greatly increased as a result of the EGR percentage increasing, to 22.58g/km.
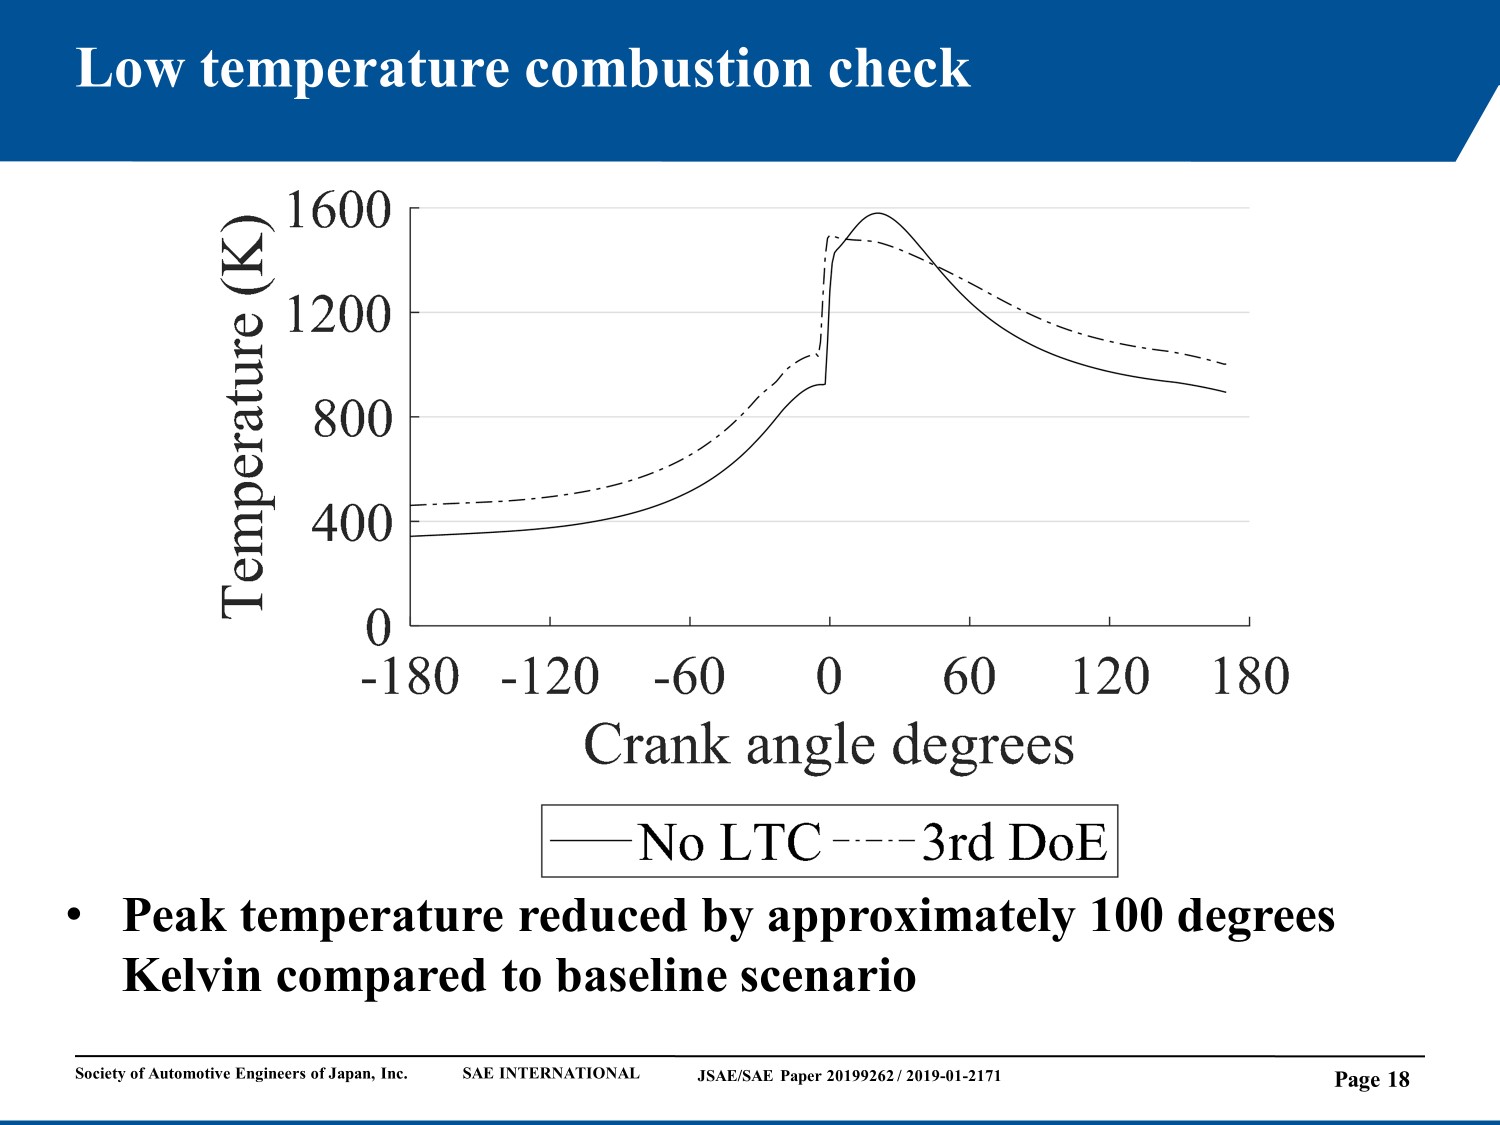
Next we wanted to see if we achieved LTC. This graph shows the peak temperature for combustion with no LTC techniques used as well as for the combustion temperature for the third factorial design. The difference in peak temperature between the two graphs is approximately 100 °K.
Conclusions
- NOx emissions were reduced by approximately 85% with an EGR percentage of 47.5 %, retarding the pilot injection and main injection SOI by 1 CAD and increasing the pilot injection duration by 200 μs.
- NOx emissions reduced by approximately 20 % with the use of 12 % EGR without exceeding the Euro 4 CO emissions limit.
- Low temperature combustion was achieved
- The method of using DoE to minimise engine out emissions was successful
Limitations
- The sample size of the experimental data is modest. By using more experimental data, more robust regression models can be constructed.
- A blind transient comparison between simulation and experimental results would be beneficial and increase our confidence in our engine simulation.
- Following the path of greatest emission reduction, was successful, but it can result in finding a local minimum, where we want to determine the global minimum.
- The DoE can be improved by investigate the whole operating map of the engine to ensure that we will be able to determine the global minimum.